S&P500 Daily Action Areas & Price Targets 20/10/2

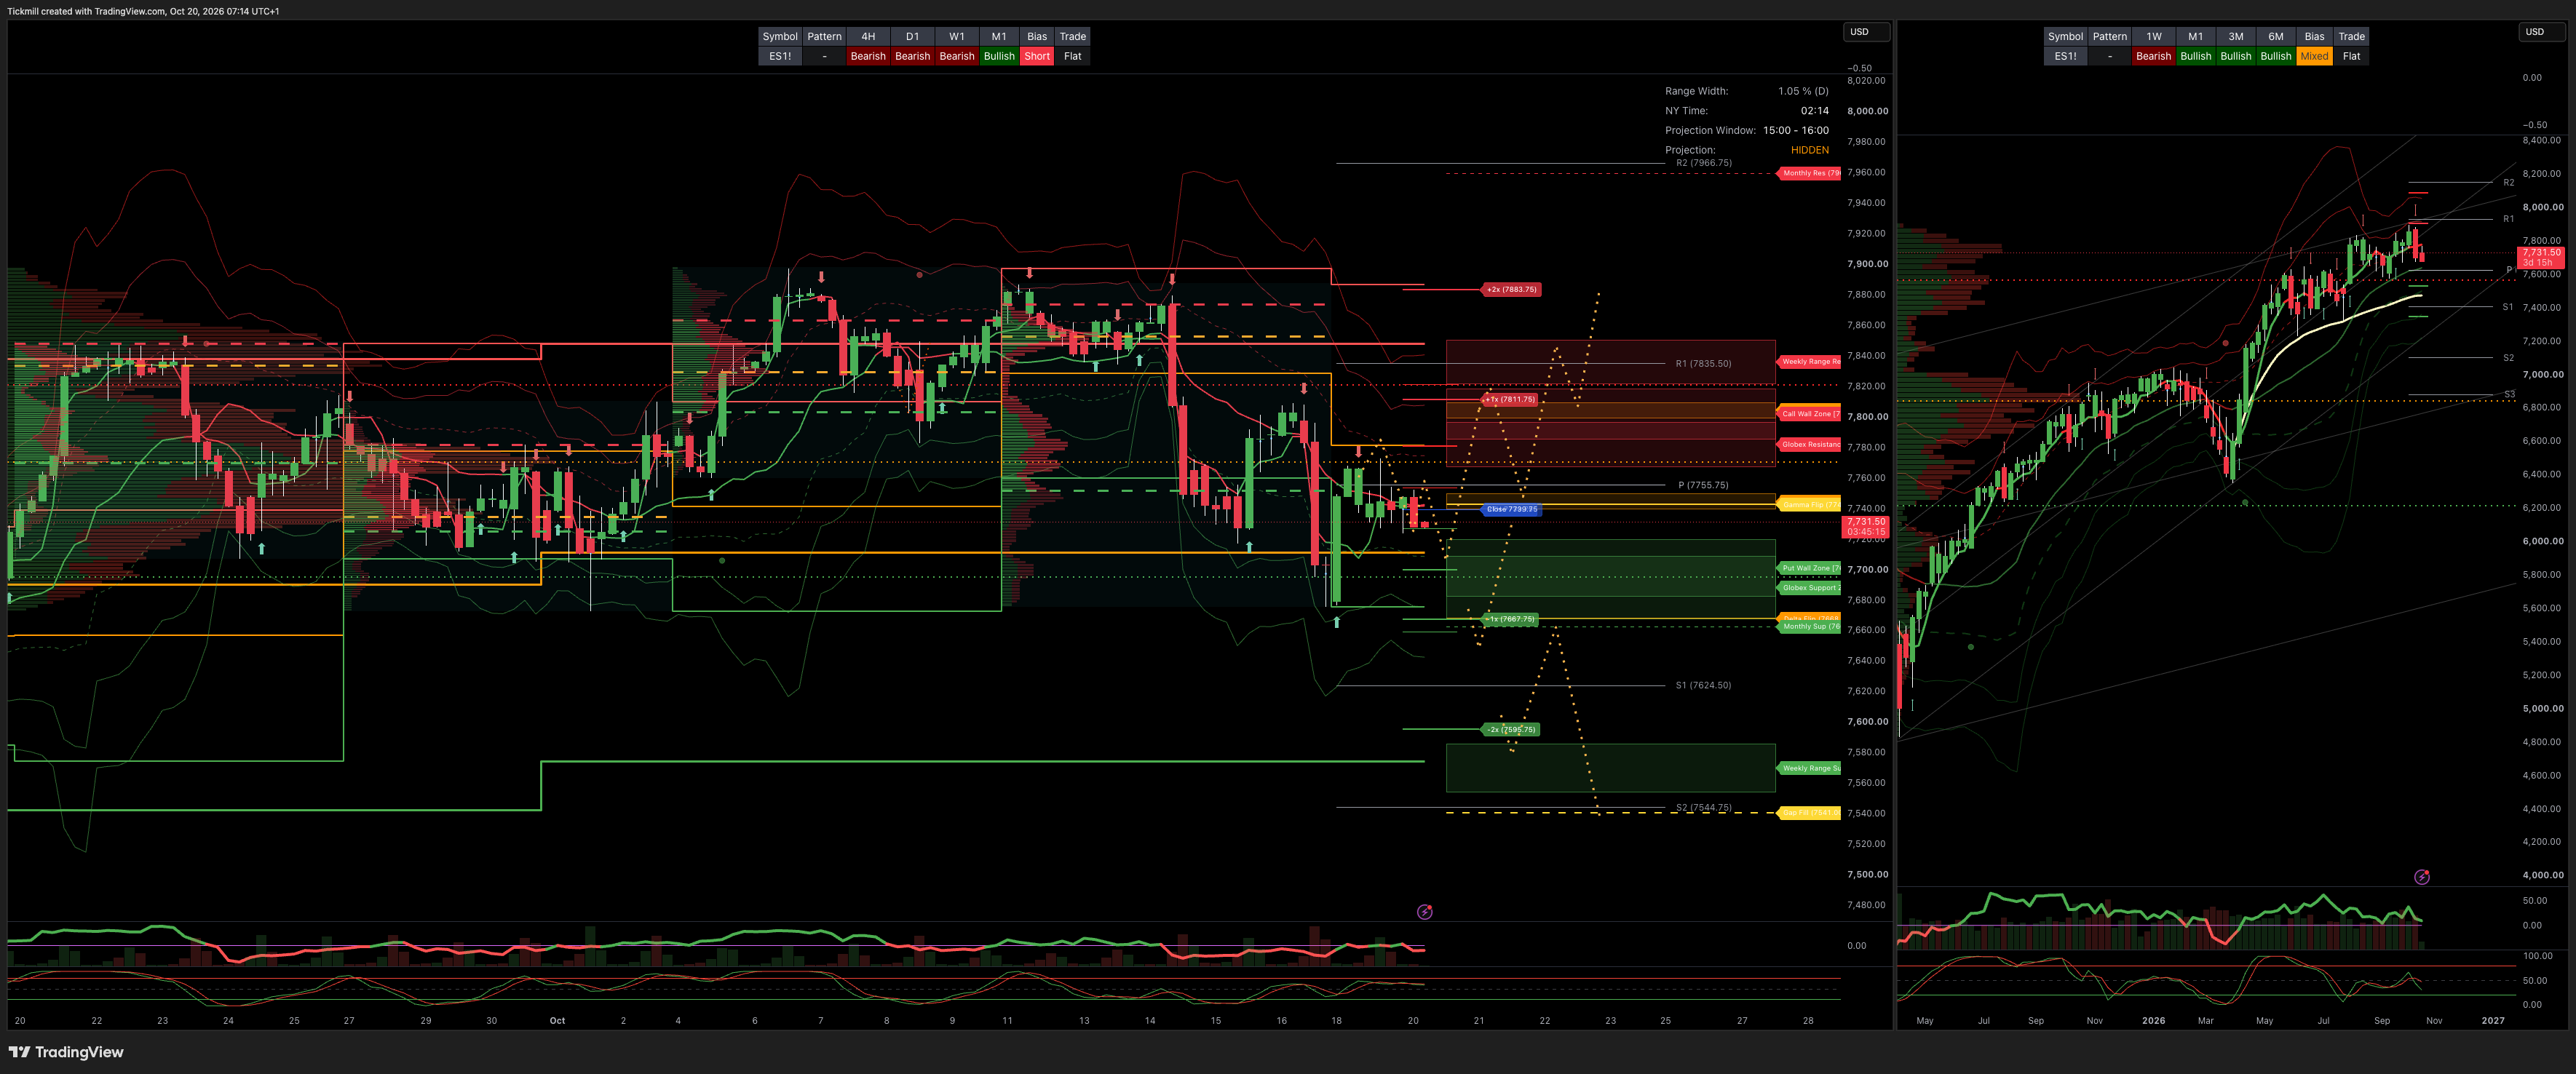
S&P500 Daily Action Areas & Price Targets 20/10/26
MONTHLY OPEX
***QUOTING ES1!(Z CONTRACT LEVLES) FOR CASH US500 EQUIVALENT LEVELS, SUBTRACT POINT DIFFERENCE***
MONTHLY-WEEKLY& DAILY LEVELS
MONTHLY BULL BEAR ZONE 7440/7400
MONTHLY RANGE RES 7960 SUP 7663
WEEKLY BULL BEAR ZONE 7800/10
WEEKLY RANGE RES 7851/22 SUP 7555/86
DAILY BULL BEAR ZONE 7740/50
GLOBEX RANGE SUP 7709/768 RES 7768/97
GAMMA FLIP 7743
DELTA FLIP 7668
CALL WALLS 7786/7819
PUT WALLS 7720/7683
DAILY STRUCTURE - OTFL - 7803
WEEKLY STRUCTURE - BALANCE - 7897/7575
MONTHLY STRUCTURE - OTFH - 7542
VIX BULL BEAR ZONE 17.7
VVIX-to-VIX The ratio of 5.80 is near the high end of the historical range, suggesting that while fears are easing, institutions maintain steady VIX option hedges, indicating cautiousness.
PRIMARY TRADES & TARGETS
LONG ON ACCEPTANCE ABOVE DBBZ TARGET WBBZ TRAGTE WEKLY RANGE RES ATH’S
***ADDITIONAL SETUPS & TARGETS HIGHLIGHTED ON THE CHARTS***
(I FADE TESTS OF 2 SIGMA LEVELS ESPECIALLY INTO THE FINAL HOUR OF THE NY CASH SESSION AS 90% OF THE TIME WHEN TESTED THE MARKET WILL CLOSE ABOVE OR BELOW THESE LEVELS)
SPX PUT/CALL RATIO 1.19 (The numbers reflect options traded during the current session.) A put-call ratio below 0.7 is generally considered bullish, and a put-call ratio above 1.0 is generally considered bearish.
JHEQX Upside cap (~7,920–7,950): Dealer gamma hedging at this call strike creates resistance, with market makers likely selling futures into strength and limiting volatility. Downside cushion (~7,270): If SPX drops 5% into Q4, long put gamma may force dealers to buy futures as the index falls, helping stabilize prices. Expiration: December 31, 2026. Strong pinning effects are likely near key strikes into year-end expiration.
DEC2025 OPEX to DEC2026 OPEX is 945 points giving us a range of [5889,7779]
Notes On Structure Implications
Balance: This refers to a market condition where prices move within a defined range, reflecting uncertainty as participants await further market-generated information. Our approach to balance includes favouring fade trades at the range extremes (highs/lows) while preparing for potential breakout scenarios if the balance shifts.
One-Time Framing Higher (OTFH): This represents a market trend where each successive bar forms a higher low, signalling a strong and consistent upward movement.
One-Time Framing Lower (OTFL): This describes a market trend where each successive bar forms a lower high, indicating a pronounced and steady downward movement.
GOLDMAN SACHS FICC & EQUITY TRADING DESK VIEWS
THE TAKE: RELIEF RALLY PAUSES HIGH-VELOCITY TECH SUPPLY AS DEALERS FLIP BACK LONG GAMMA
US equity benchmarks kicked off the week with a calm, relief-driven rebound, led by mega-cap technology and growth indices (Nasdaq-100 +1.17% to 29,529; S&P 500 +0.41% to 7,690). The advance reflected a distinct cessation of the aggressive, high-velocity institutional supply that dominated floor flows last week.
As major indices recovered from Friday's acute drawdown, market structure experienced a crucial transition: the options market shifted back into a pocket of long dealer gamma. This transition comes on the heels of a historic 5-day dealer gamma decline (the largest in 4 years), restoring a structural volatility cushion to the index level.
Despite the spot relief, hedge fund conviction remains at year-to-date lows as accounts grapple with a complex matrix of macro and micro uncertainties—including Q3 earnings execution, US midterms, elevated bond yields/credit spreads, ROIC sustainability, and long-term 2028 supply/power constraints.
MARKET SUMMARY & ASSET BREAKDOWN
S&P 500 (SPX): Closed at 7,690.00 (+0.41%) | MOC $7.9B to SELL | VIX down -7.90% to 18.41
Nasdaq-100 (NDX): Closed at 29,529.00 (+1.17%) | Outperformed on relief-buying and short covering in Tech
Russell 2000 (RUT): Closed at 2,731.00 (+0.36%) | Lagged tech recovery as 10-Year yields edged higher
Dow Jones (DJI): Closed at 51,966.00 (-0.07%) | Slight drag from traditional industrial/value components
US 10-Year Treasury: Yield up +6 bps to 5.13% | Yields pushed back above 5.10% following recent duration buying
WTI Crude: Price up +2.25% to $103.69/bbl | Resumed upward march past $103/bbl on Middle East supply watch
Gold: Price down -0.61% to $4,140.00/oz | Consolidated under real rate and USD pressure (DXY 101.99)
Bitcoin: Price up +1.14% to $81,789.00 | Bounced in line with growth risk assets
INSTITUTIONAL FLOWS & EARNINGS WATCHLIST
Trading Floor Activity (3/10 Rating):
Execution floor volume was muted with benign flow skews across both Asset Managers and Hedge Funds.
Long-Only (LO) accounts maintained mild sell skews in Semiconductors, but selling intensity was markedly reduced relative to late last week, accompanied by minimal fresh long buying.
AI & Tech Earnings Acceleration Week:
Tuesday: SpaceX (
SPCX).Wednesday: Meta Platforms (
META), IBM (IBM), Lam Research (LRCX).Thursday: Western Digital (
WDC), Bloom Energy (BE), Blackstone (BX).
DERIVATIVES & VOLATILITY SURFACE COLOR
Volatility & Skew Compression: Following Friday's historic VIX call surge, short-dated SPX implied volatility and options skew were heavily offered right from the opening bell, maintaining compressed levels throughout the session.
Dealer Gamma Shift: The spot recovery pushed dealers back into net long gamma territory, reinstalling a volatility-dampening buffer after last week's -$5.9B gamma drain.
Upside Option Restructuring: Desk observed index vol selling and limited appetite to chase linear upside. Tactical option flows centered on rolling up short-dated upside calls in Alphabet (
GOOGL), Amazon (AMZN), and SK Hynix (SKHY).Featured Volatility Setup: The QQQ Friday Straddle is priced at 2.0%, capturing Meta's Wednesday post-close earnings. The desk favors owning QQQ or META gamma as offering a highly compelling risk/reward profile into the print.
Disclaimer: The material provided is for information purposes only and should not be considered as investment advice. The views, information, or opinions expressed in the text belong solely to the author, and not to the author’s employer, organization, committee or other group or individual or company.
Past performance is not indicative of future results.
High Risk Warning: CFDs are complex instruments and come with a high risk of losing money rapidly due to leverage. 68% and 74% of retail investor accounts lose money when trading CFDs with Tickmill UK Ltd and Tickmill Europe Ltd respectively. You should consider whether you understand how CFDs work and whether you can afford to take the high risk of losing your money.
Futures and Options: Trading futures and options on margin carries a high degree of risk and may result in losses exceeding your initial investment. These products are not suitable for all investors. Ensure you fully understand the risks and take appropriate care to manage your risk.
Patrick has been involved in the financial markets for well over a decade as a self-educated professional trader and money manager. Flitting between the roles of market commentator, analyst and mentor, Patrick has improved the technical skills and psychological stance of literally hundreds of traders – coaching them to become savvy market operators!